Debugger
Where you want us
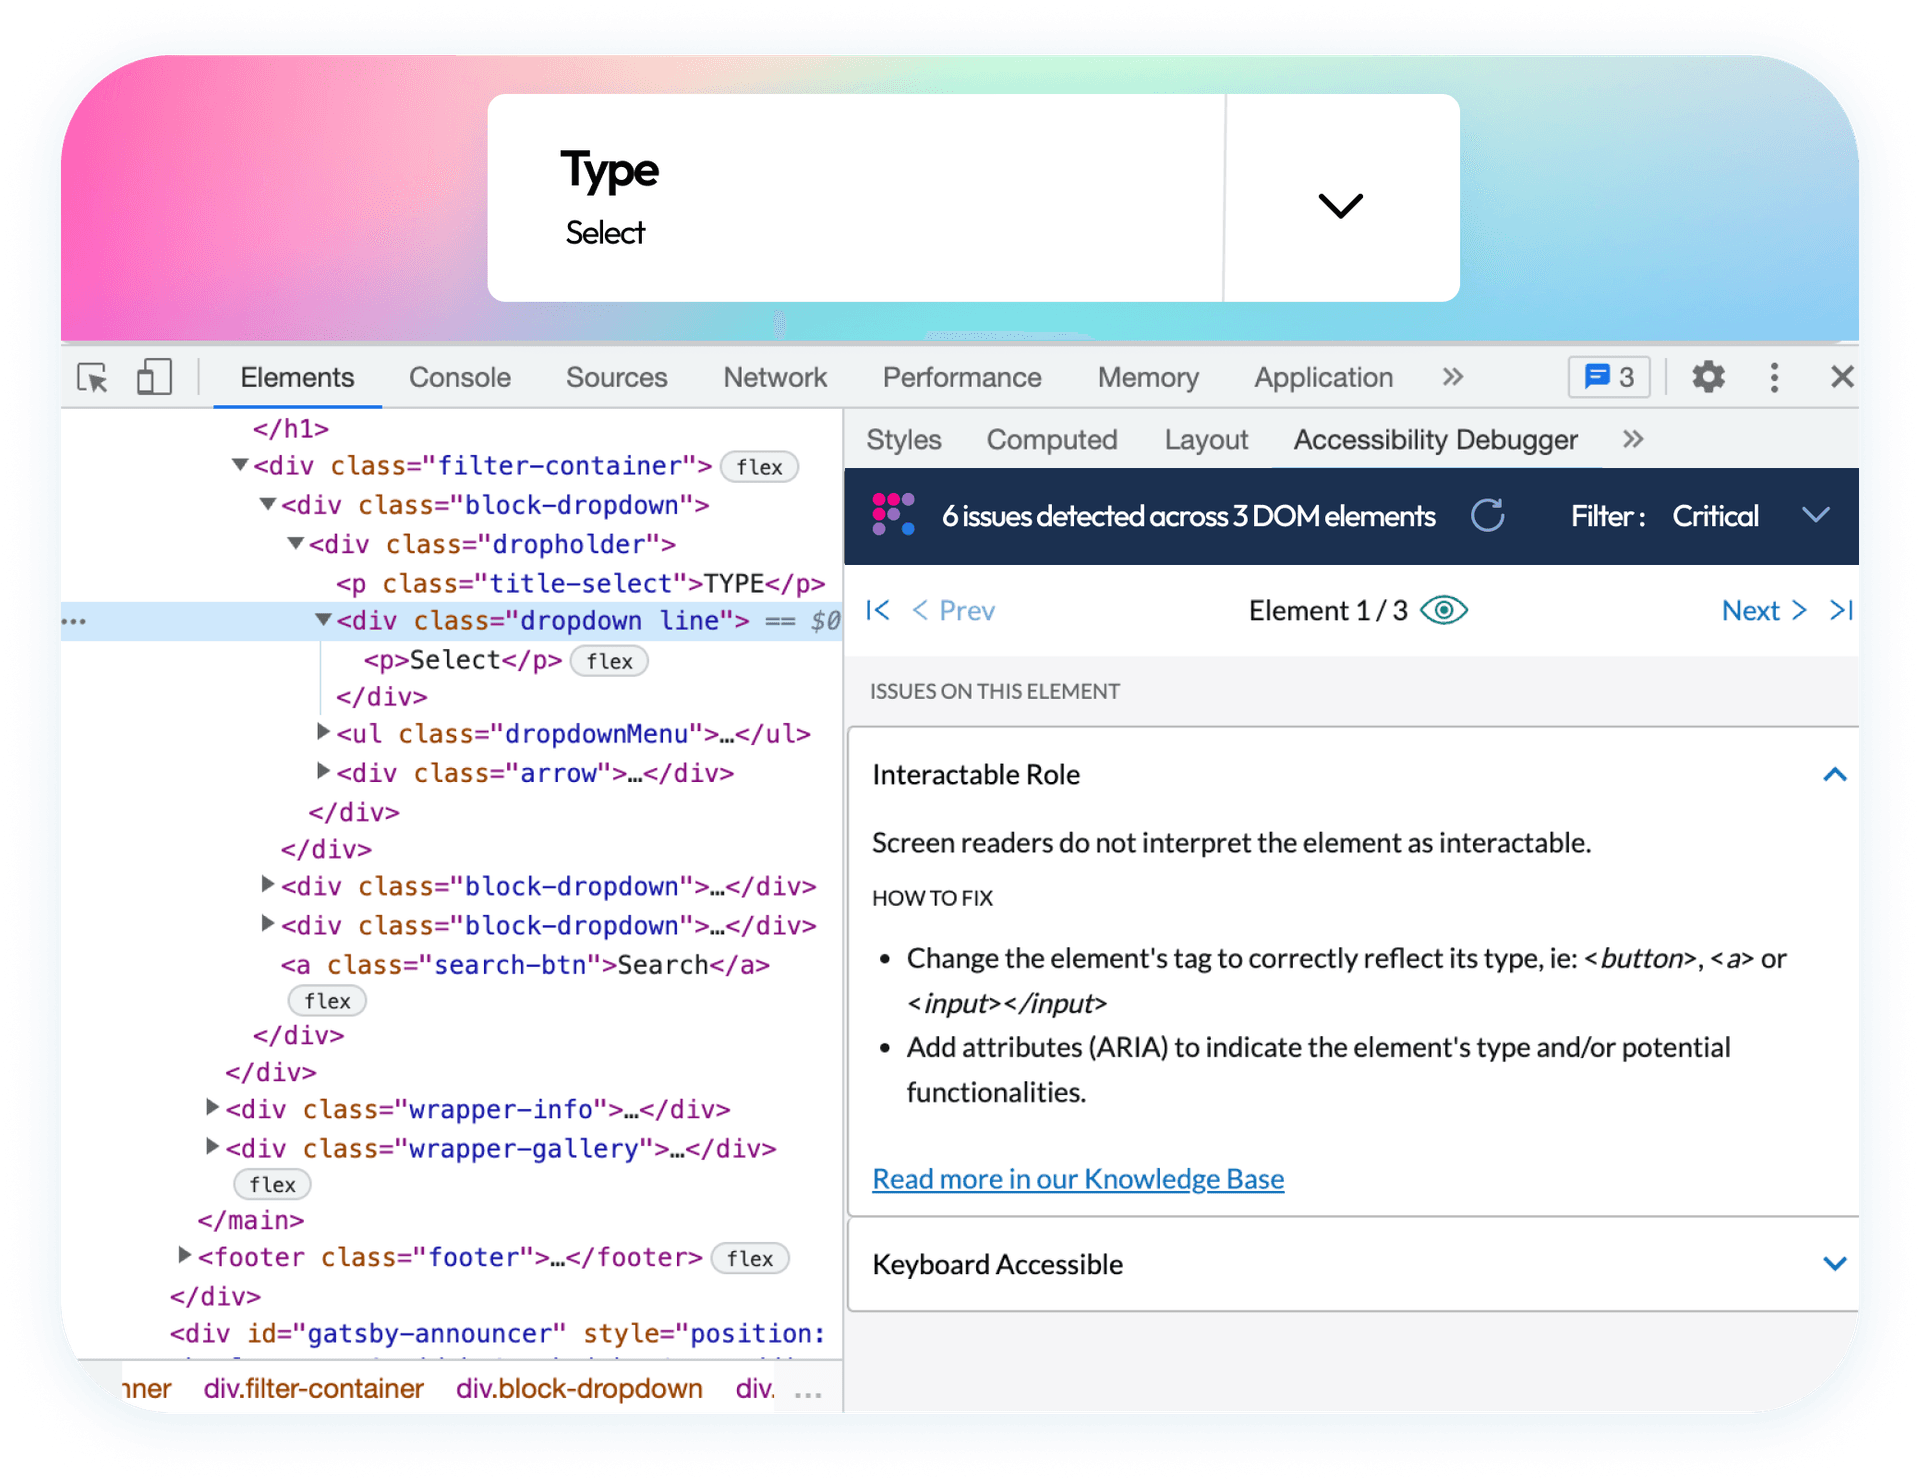
You can get many of the benefits of Evinced in one handy place: inside the Developer Tools window of your Chrome browser.
That means you can instantly see the accessibility impact of code changes, inside a tool you’re already familiar with.

Find More Bugs
Our usual magic
Our debugger tool for Chrome has all of our machine learning intelligence built in. Meaning it will find and discover critical accessibility problems (like code that isn’t accessible for people using screen readers or keyboards to access your site). Without Evinced, you’d need a manual audit to find bugs like that. Now you can find — and fix — these issues, right in your Chrome developer tools window. To date our customers typically find 19 times more critical issues with our tools (on average) than they did with legacy tools like Axe and Lighthouse.
More reasons
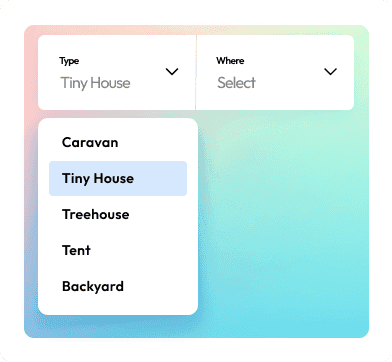
Synched to page state
As you make changes to the page you’re looking at, Debugger can re-analyze the DOM elements you’ve altered and tell you whether your changes are successful.
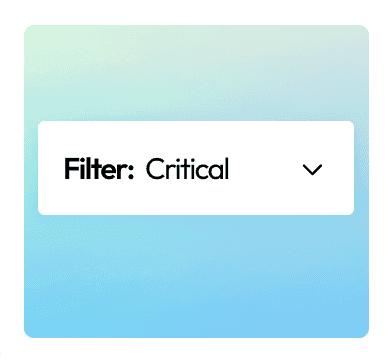
Smart filter
You can easily set Debugger to report only on Critical issues that are functional blockers for assistive technology devices. Or get the full list and polish your code until it’s perfect.
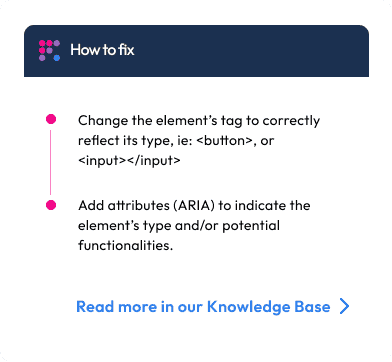
Guidance
Each issue comes with how-to-fix suggestions that you can test right away, from right in the developer tools window. Make your Agile process more agile!